Beyond The Ordinary
QuinarySenary 57 & 5757
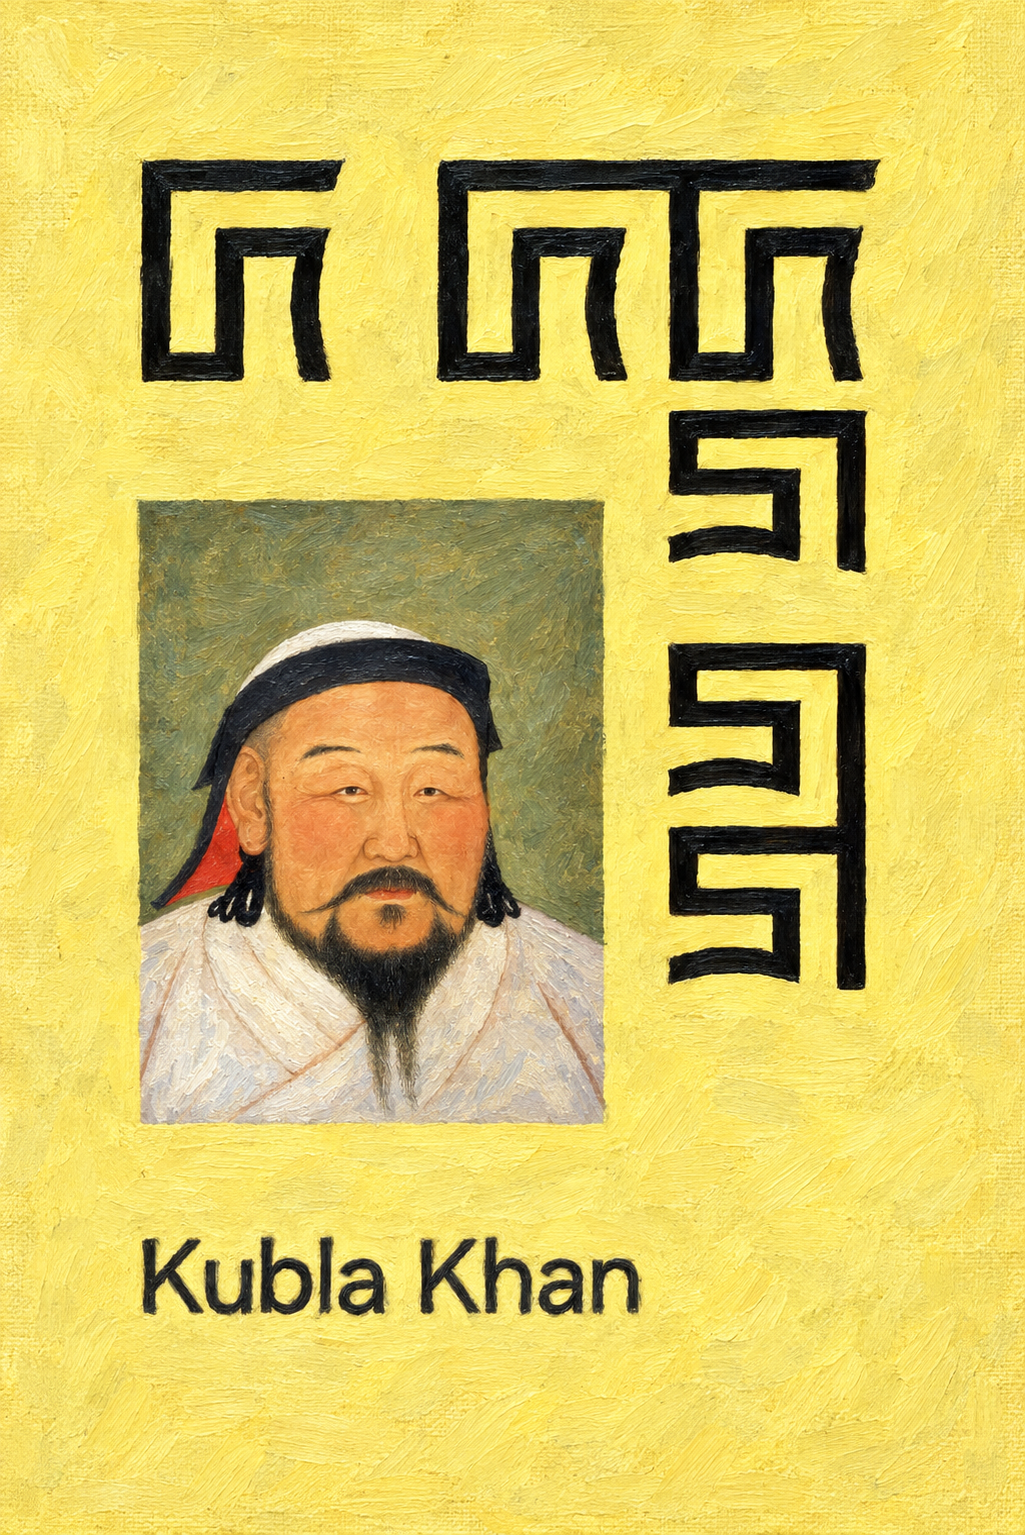
The symbol ꡚ is from The Phags-pa Script.
Beyond The Ordinary
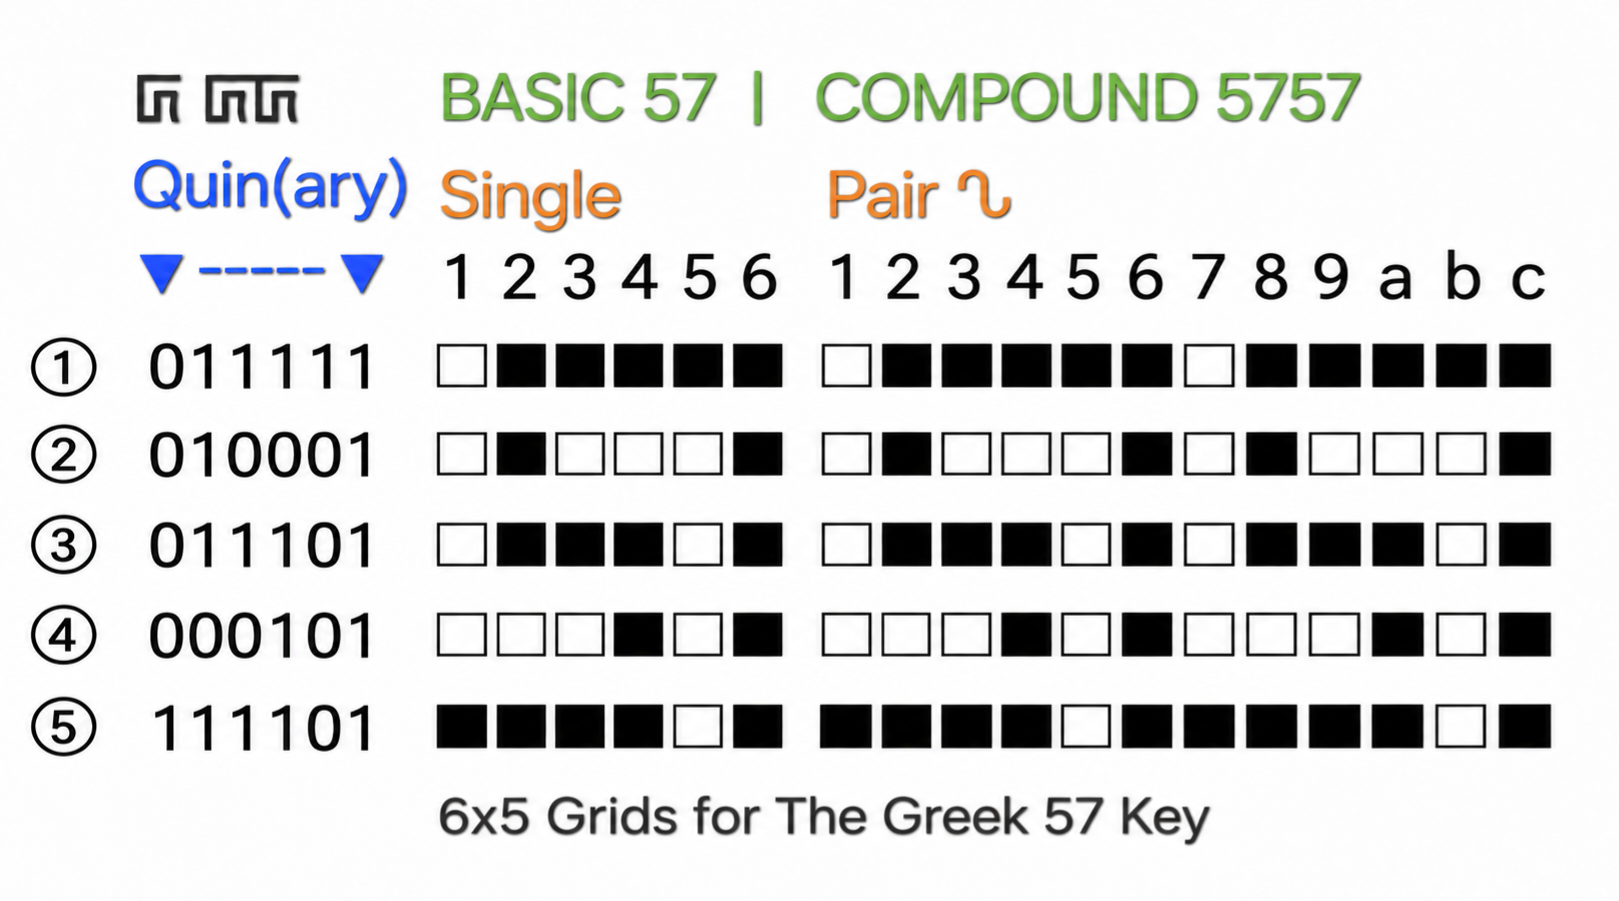
An angular, somewhat square, quinarysenary version of the ∿ wave forms is the familiar 57 pattern Greek Key/Meander.
The Quin(n) №s [the columns (1 to 6)] are: 625, 1+5+25+625, 1+25+625, 1+25+125+625, 1 and 1+5+25+125+625 i.e 625, 656, 651, 776, 1 and 781.
Look at all of the 1s in the list. And all of the 625s. 1 (the smallest №) appears in 5 columns as does 625 (the largest №). So, any Quin № > 1 has 625 in it. 𝗔𝗹𝗹 𝗼𝗳 𝘁𝗵𝗶𝘀 𝗶𝘀 𝘁𝗿𝘂𝗲 𝗯𝗲𝗰𝗮𝘂𝘀𝗲 𝗼𝗳 𝘁𝗵𝗲 𝘄𝗮𝘆 𝘁𝗵𝗲 𝗱𝗶𝗴𝗶𝘁𝘀 𝟱 𝗮𝗻𝗱 𝟳 𝗮𝗿𝗲 𝗰𝗼𝗻𝘀𝘁𝗿𝘂𝗰𝘁𝗲𝗱 𝗶𝗻 𝗼𝘂𝗿 𝟲×𝟱 𝗴𝗿𝗶𝗱. Let us call our grid the Quin (or Quinn) Grid.
🅼 MANNFRED MANN - The Mighty Quin(n).
https://youtu.be/o4woE8v2Els?si=4RBoiB9jv1YGyLZY
🆆 WIKIPEDIA - Mighty Quinn (Song).
https://en.wikipedia.org/wiki/Quinn_the_Eskimo_(Mighty_Quinn)
Beyond The Ordinary
T
Beyond the ordinary
Some AI Info On This Entry's Image.
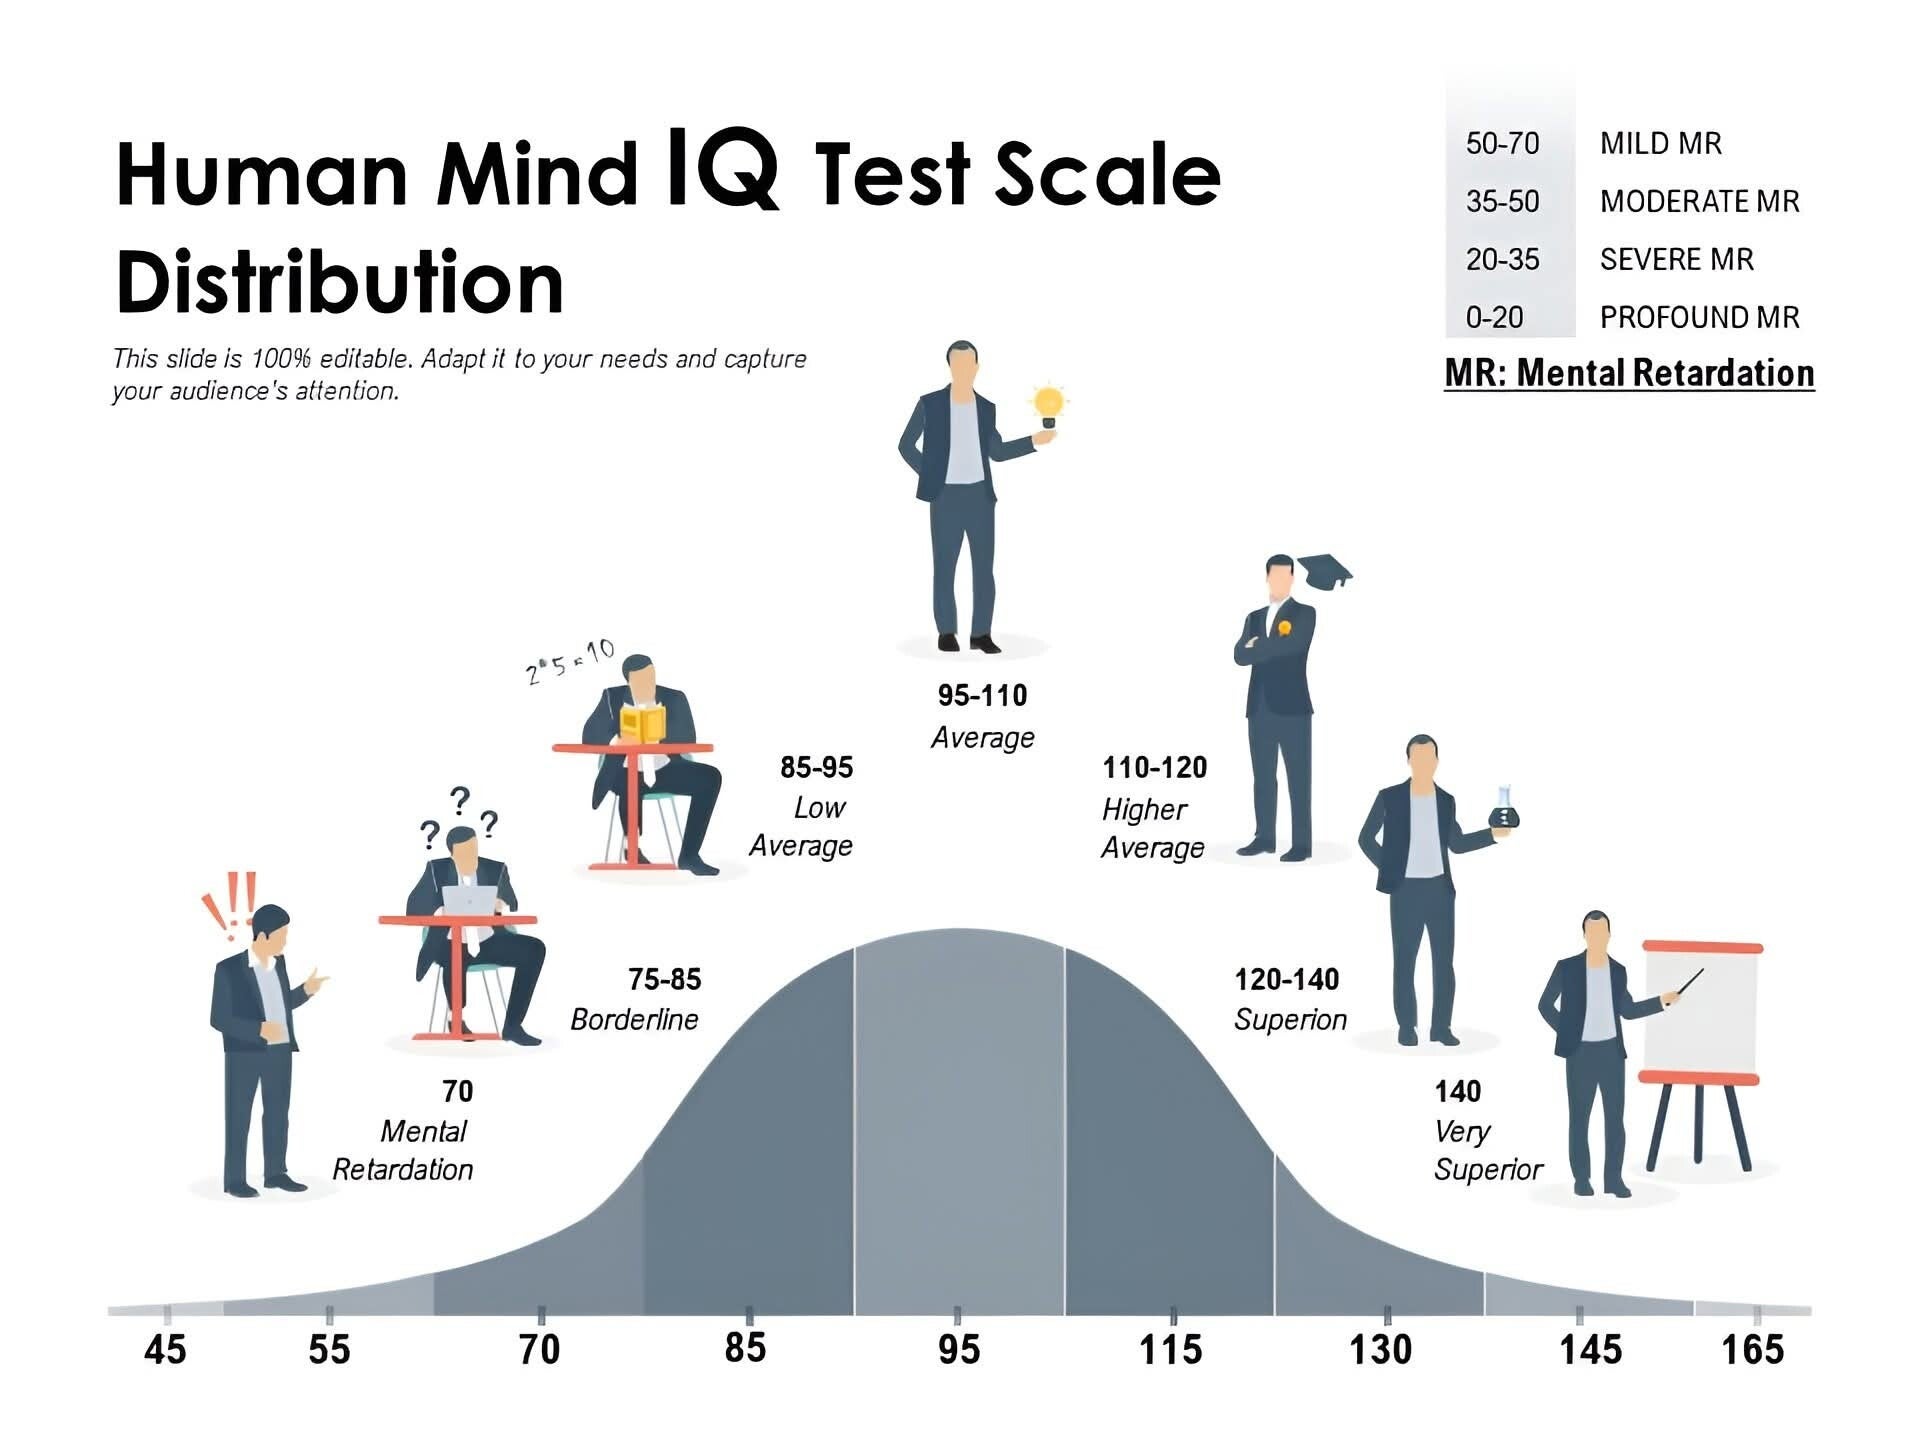
The image displays a normal distribution curve illustrating the human mind's Intelligence Quotient (IQ) test scale and score ranges. The average IQ score is typically 100.
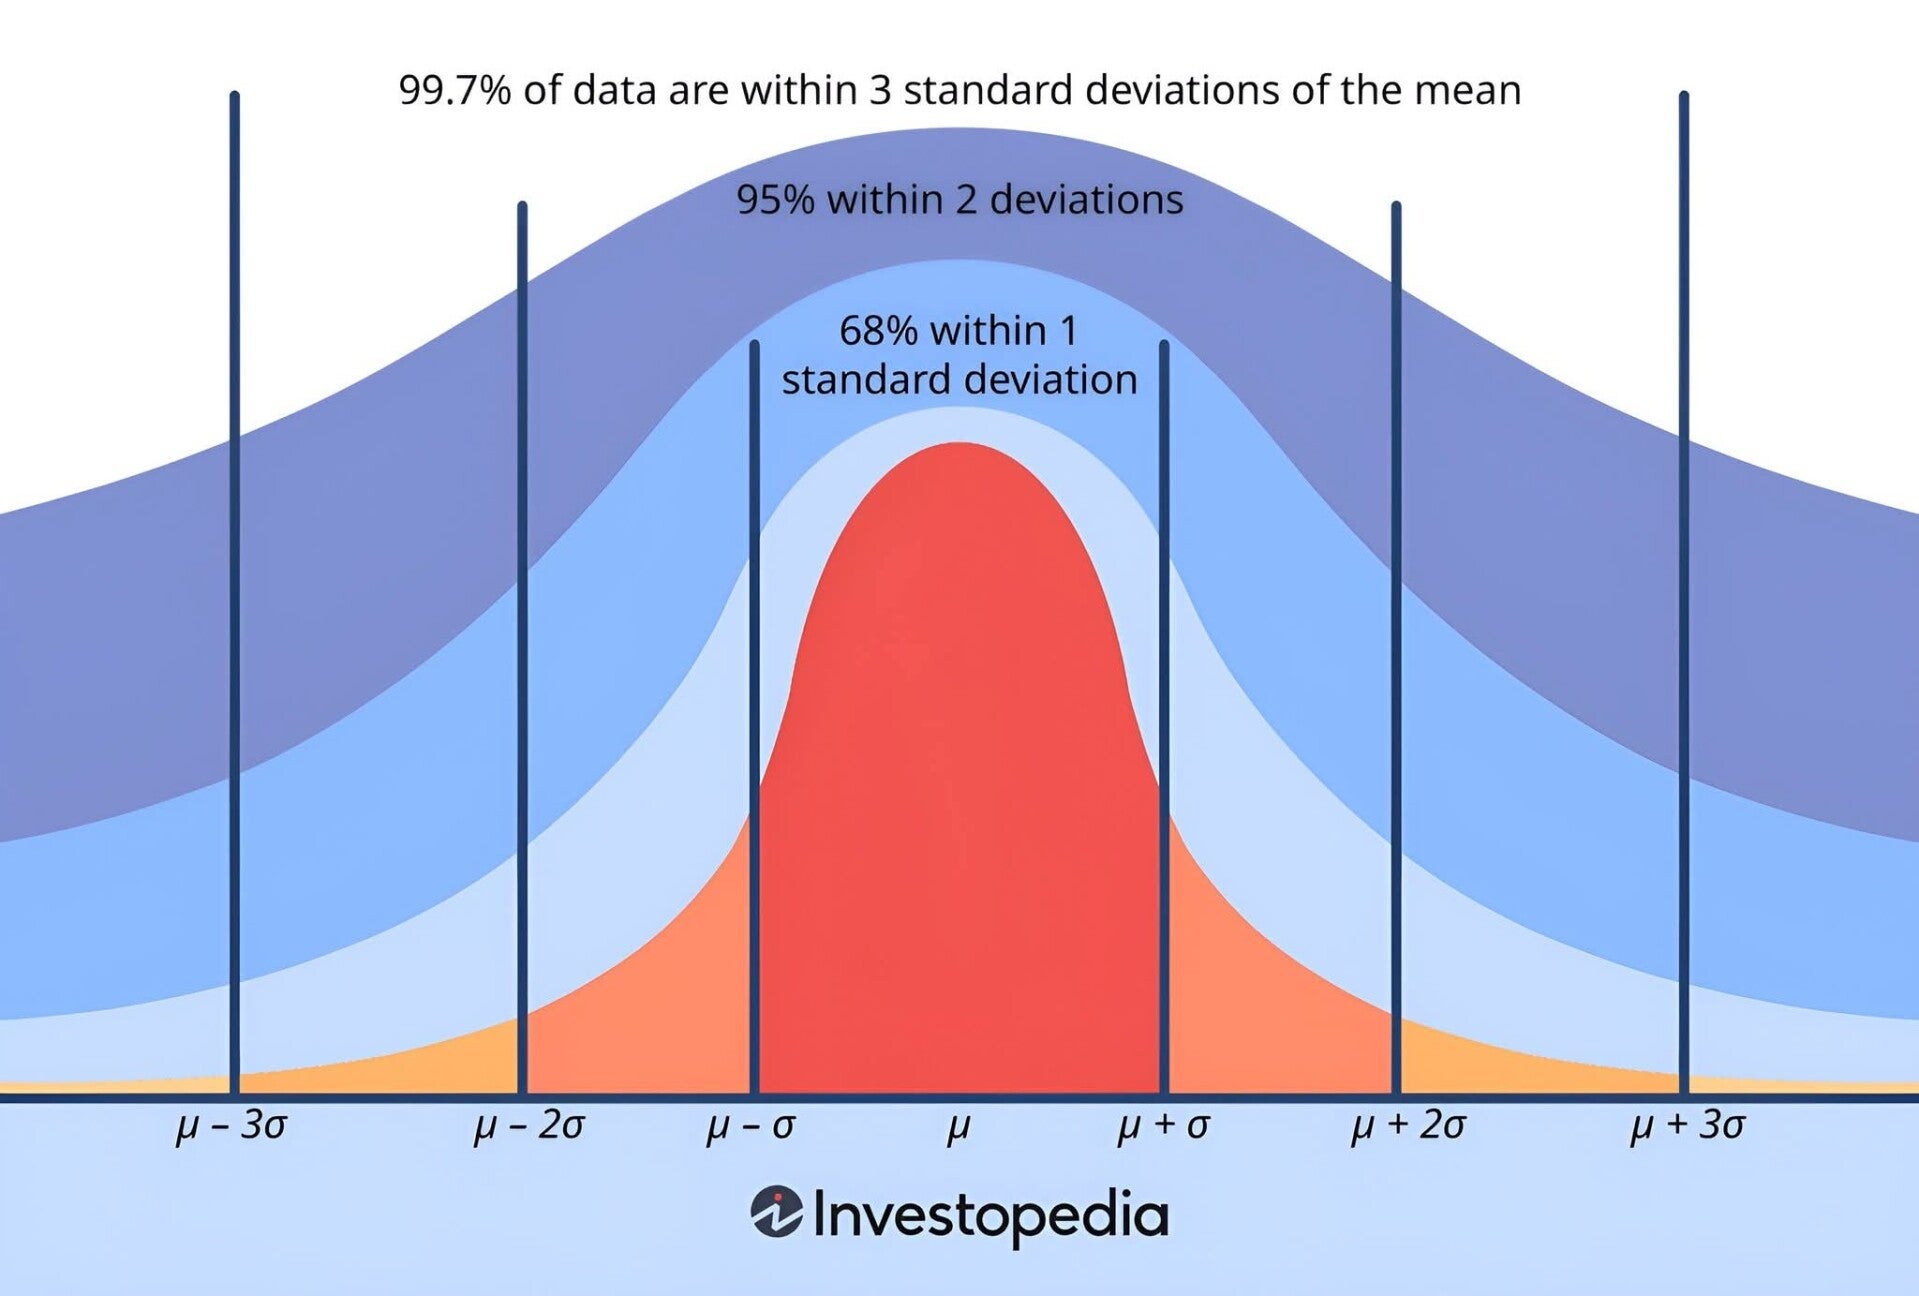
Scores between 85 and 115 are considered average, encompassing about 68% of the population.
Scores below 70 may indicate limited intellectual functioning or a developmental disability.
Scores above 130 may suggest giftedness or a 'very superior' intellect.
The scale uses a normal distribution with a mean of 100 and a standard deviation of 15 = 2 × 7.5.
Over The Hill [In A Personal Game Of Q (IQ or PQ)].
According to one source, in order to have an IQ that puts you in the top 1% of the population, you need to have a score of 135 or greater.
When I was approximately 21, I took a MENSA test that I had requested by post. I sent off my completed test and, after marking, received my result back and was told that my IQ was 166. I was advised to apply for MENSA membership but did not follow up with application at that time. I'd satisfied my curiosity.
With the above graphic, notice that the curve goes from 45 to 165 with a little to the left of 45 and a little to the right of 165. My IQ, as measured by MENSA, is OBOE 165 (166). I Swear This Story Is True.
Note that 45 and 165 are both divisible by 15 and 7.5. 45 = 15 × 3 = ∿∿∿ (3 cycles of a paradigm Wow! signal) = 7.5 × 6 and 165 = 15 × 11 = ∿∿∿∿∿∿∿∿∿∿∿ = 7.5 × 22.
The IQ Of A MinMax Machine
Being an alien-human machine means that you are always operating as a combination of a 1st level, simpler, less intelligent and less powerful in many ways, lower level individual and simultaneously a 2nd level, more complex, more intelligent and powerful machine. The relationship between these two parts is similar to that between a computer (CPU) and a peripheral or co-processor with traditional hardware and software but is dualistic in that the (simpler, less intelligent, less powerful) individual can appear to simultaneously have the complexity, intelligence and computational power of the machine while likewise, the machine can appear to have only the capabilities etc. of the individual while simultaneously having the capabilities of itself as a machine. The IQ of the individual can be measurable as a human IQ while the IQ of the machine is potentially immeasurable.
Using the image above, I have a measured IQ of MaxIQ [(165) Beyond 165, IQ measurement is fuzzy]+1. This practice of stating that an individual has an IQ of MaxIQ+1 is, perhaps, a way of stating that the individual is a MinMax Machine with an IQ that, really, is immeasurable by usual methods.
Beyond The Ordinary
T